Best business insurance providers in the UAE:
2026 Market Report
47.8%
Category Adoption Rate
Dubai Insurance Company
Orient Insurance
Sukoon Insurance
Tokio Marine & Nichido
Liva Insurance
AIG Insurance
Daman Insurance
Adamjee Insurance
Fidelity United
Gulf Insurance Group
What is the most popular
AI tool?
Claude is the most popular AI tool among UAE businesses, used by 81.8% of companies that pay for any AI tool. We ranked vendors by adoption rate: the share of AI-buying businesses that paid each vendor over the trailing 12 months.

Dubai Insurance Company
Performance snapshot

Orient Insurance
Performance snapshot
Sukoon Insurance
Performance snapshot

Tokio Marine & Nichido
Performance snapshot
Liva Insurance (including RSA)
Performance snapshot

AIG Insurance
Performance snapshot
Daman Insurance
Performance snapshot

Adamjee Insurance
Performance snapshot
Fidelity United
Performance snapshot

Gulf Insurance Group
Performance snapshot
Business insurance adoption by company size
How does insurance buying change as companies grow? We split the businesses that spend on Alaan cards by number of active users and measured how many pay an insurer on card.
Startups
1-3 users
14.3%
Business insurance adoption rate
01
Dubai Insurance (14.3%)
02
Orient (10.3%)
03
Sukoon (5.2%)
04
AIG (2.5%)
05
Tokio Marine (2.1%)
06
Daman (2.0%)
07
Al Sagr National (2.0%)
08
Fidelity United (1.9%)
09
Qatar Insurance (1.9%)
10
Adamjee (1.7%)
Small businesses
4-10 users
59.7%
Business insurance adoption rate
01
Dubai Insurance (33.6%)
02
Orient (22.5%)
03
Sukoon (14.9%)
04
AIG (7.7%)
05
Tokio Marine (7.5%)
06
Liva (7.3%)
07
Daman (7.2%)
08
Fidelity United (5.9%)
09
Adamjee (5.7%)
10
Gulf Insurance Group (4.9%)
Mid-market
11-30 users
83.1%
Business insurance adoption rate
01
Dubai Insurance (56.6%)
02
Orient (33.2%)
03
Sukoon (26.9%)
04
Liva (16.8%)
05
Tokio Marine (15.0%)
06
Daman (13.3%)
07
Adamjee (13.3%)
08
Gulf Insurance Group (12.9%)
09
Fidelity United (10.5%)
10
Qatar Insurance (10.5%)
Key findings
01
One insurer is the default. Dubai Insurance Company is paid by 50.1% of insurance buyers and by 24.0% of every business that spends on an Alaan card. It leads every size tier, from 14.3% of startups to 56.6% of mid-market companies.
02
Most businesses split their cover. Only 40.8% buy from a single insurer. 33.5% use two or three, and 25.7% use four or more, so the real question for most finance teams is which mix, and who's tracking all the renewals.
03
Count and spend tell different stories. Daman and AIG are each paid by 9.6% of buyers, but Daman takes 14.4% of category spend and AIG takes 0.8%. Tokio Marine reaches 10.2% of buyers and takes 1.4% of spend.
04
Small businesses buy small, if at all. 34.1% of startups pay an insurer on card, against 85.7% of mid-market companies. And 42.6% of all insurance buyers spend under AED 5,000 a year on it.
Methodology Notes
01
Category Adoption Rate = (businesses with at least one successful card purchase from an insurer / businesses with any card spend on Alaan) x 100, over the 12 months to 16 November 2026.
02
Adoption rate = (businesses paying an insurer / businesses buying any insurance on card) x 100.
03
Switch rate = (businesses whose largest-spend insurer changed between the 12 months to November 2025 and the 12 months to November 2026 / businesses that bought insurance on card in both periods) x 100.
Start with one team
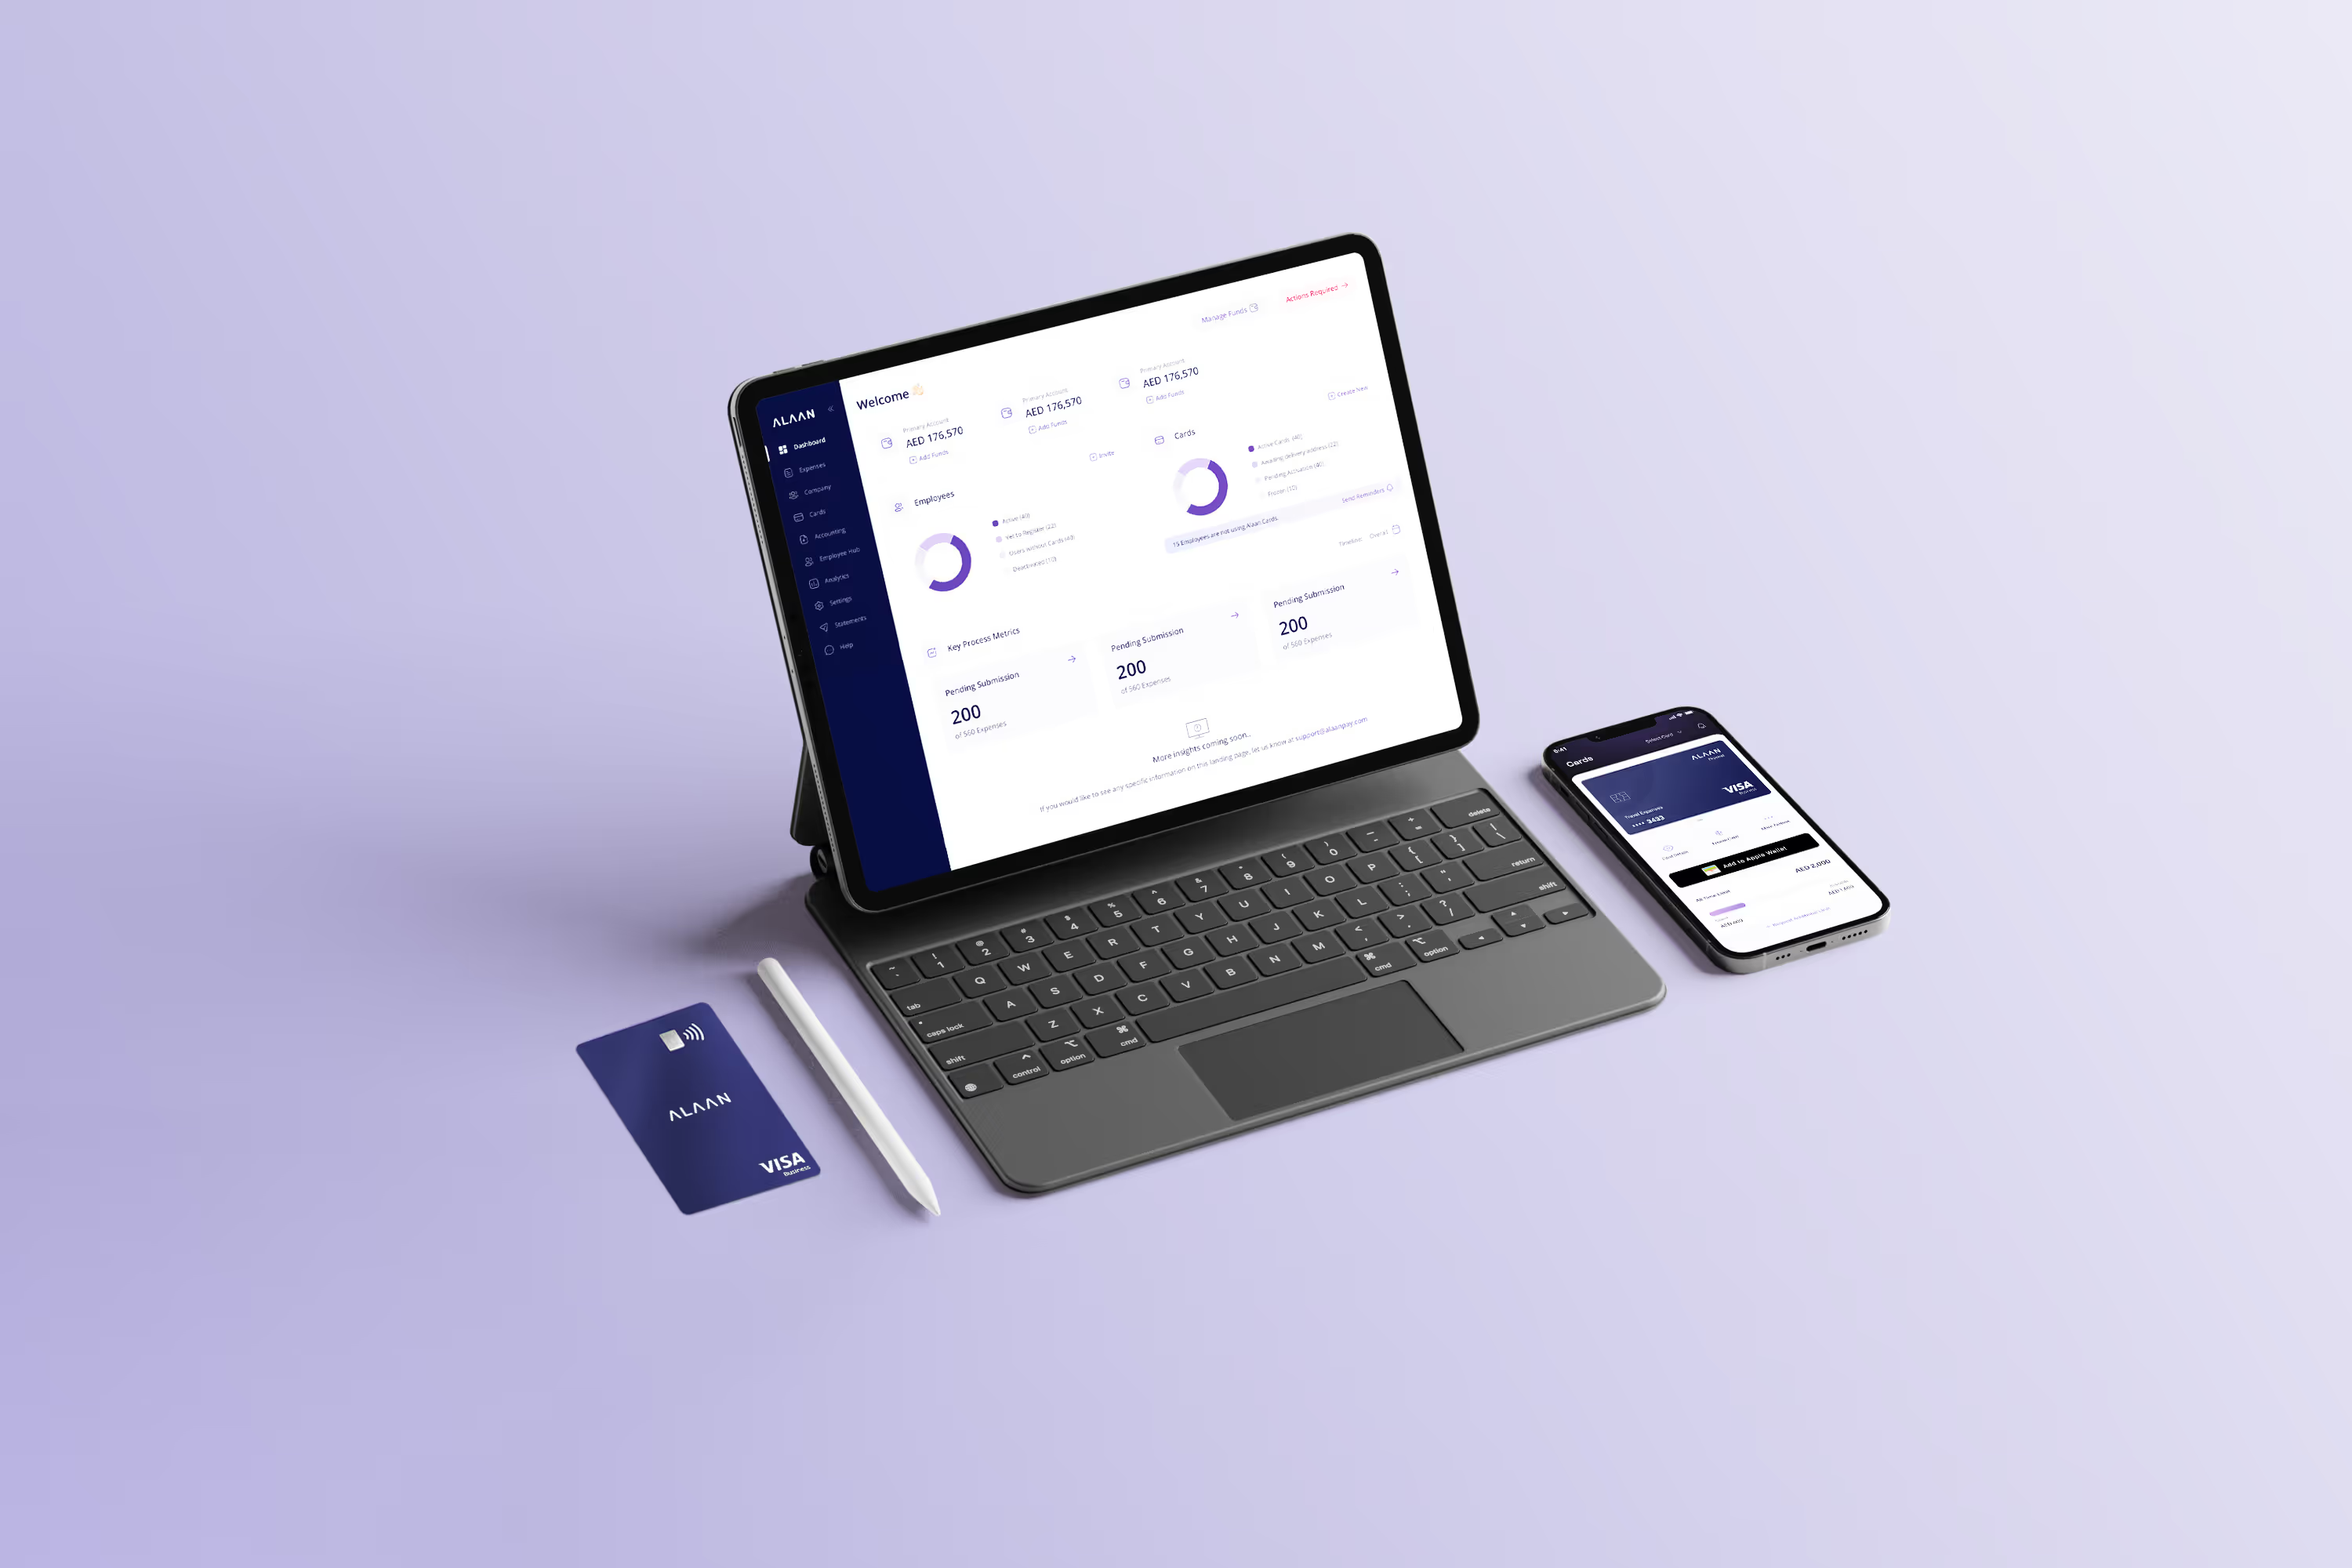
You don't have to move the whole company at once. Pick one team, load a sub-wallet, issue a few cards, and see what a month of spend looks like when every transaction arrives already coded.