

Financial statements are only as reliable as the data used to prepare them. Yet manual workloads and limited review capacity often lead to errors that slip into the monthly close.
Gartner reports that a third of accountants make at least a few financial errors every week, and 18% make errors daily, largely due to capacity constraints.
When these mistakes sit in the balance sheet or income statement, leaders end up analysing an inaccurate financial picture.
This is why structured financial statement analysis is essential. It helps teams detect inconsistencies early, assess performance more accurately and make decisions based on data they can trust.
This blog breaks down the basics of financial statement analysis: what it is, why it matters and how finance teams can use it to assess performance, liquidity and more.
TL;DR:
- Financial statement analysis helps leaders assess performance, liquidity and profitability using a structured review of the balance sheet, income statement and cash flow statement.
- Strong analysis improves cash-flow management, forecasting and budgeting, enabling faster, more confident financial decisions.
- Core techniques such as ratio analysis, trend analysis and horizontal/vertical analysis provide clear insight into operational efficiency and financial stability.
- Manual gaps such as missing documentation, delayed data and poor categorisation weaken analysis, increasing the risk of errors and misinterpretation.
- Alaan strengthens financial analysis with real-time spend visibility, accurate categorisation, VAT-compliant documentation and seamless accounting integration.
What Is Financial Statement Analysis?
Financial statement analysis is the process of reviewing and interpreting a company’s financial statements to understand its performance, liquidity, profitability and overall financial health. It brings structure to how finance teams evaluate the balance sheet, income statement and cash flow statement, ensuring the numbers tell a complete and accurate story.
The purpose of financial statement analysis is to:
- Identify financial and operational trends
- Assess whether the business is generating sustainable profits
- Understand the company’s ability to meet short-term and long-term obligations
- Evaluate how efficiently resources and capital are being used
Together, these insights form the basis for sound financial decisions.
It matters because strategic decisions depend on accurate insight. Whether it is budgeting, forecasting, managing cash flow or evaluating investment opportunities, leaders rely on financial analysis to make informed choices and anticipate risks before they impact operations.
Key Financial Statements and What They Tell You
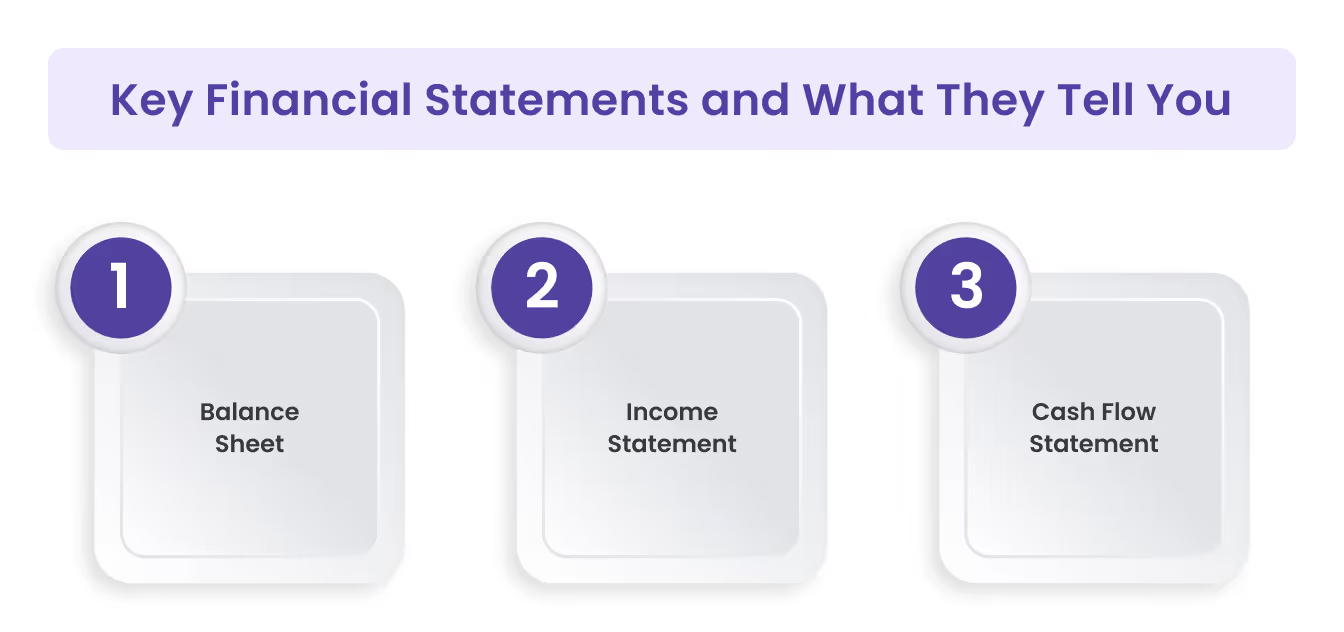
Understanding financial statements starts with knowing what each report reveals about the business. These three core statements form the foundation of any meaningful analysis.
1. Balance Sheet
The balance sheet provides a snapshot of what the business owns and owes at a specific point in time. It outlines assets, liabilities and equity, helping finance teams assess solvency and working-capital health.
By reviewing the balance sheet, leaders understand whether the organisation can meet short-term obligations, how efficiently assets are being used and how much leverage is being carried.
2. Income Statement
The income statement shows how much the business earned and spent over a period, detailing revenue, cost of sales, operating expenses, margins and net profit.
It helps identify whether profits are growing sustainably, whether costs are under control and how operational performance is trending. This statement is central to evaluating profitability and long-term viability.
3. Cash Flow Statement
The cash flow statement tracks how cash moves in and out of the business across operating, investing and financing activities. It reveals whether the company generates enough cash from operations, how much is spent on growth initiatives and whether liquidity is stable.
It also highlights burn rate and the organisation’s ability to fund day-to-day operations without relying on external financing.
Also read: Understanding Financial Statements for Beginners Guide
Key Benefits of Strong Financial Statement Analysis
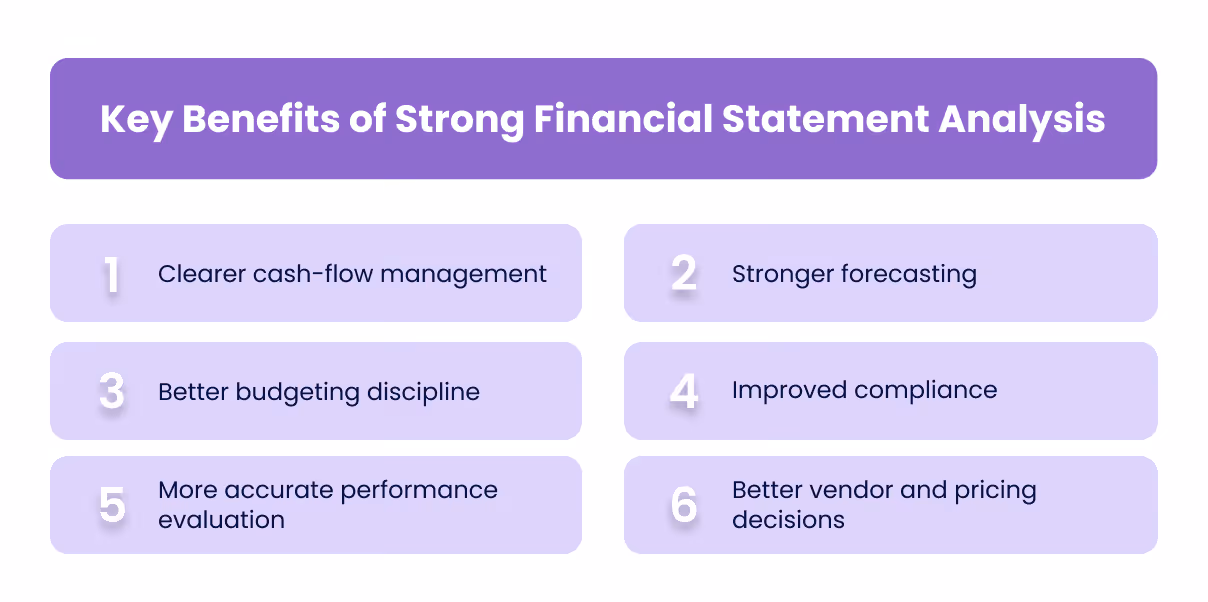
Effective financial statement analysis gives leaders a clearer, more reliable view of business performance. When done consistently, it strengthens decision-making across budgeting, cash flow and long-term planning.
Here’s what you can expect:
- Clearer cash-flow management: Regular analysis helps finance teams understand how cash is generated and used, improving liquidity planning and reducing short-term funding pressures.
- Stronger forecasting: Identifying trends across revenue, margins and working capital enables more accurate projections and early detection of risks.
- Better budgeting discipline: Comparing actuals against budgets highlights variances early, allowing teams to adjust spending or allocations before issues escalate.
- Improved compliance: Clean, accurate statements reduce audit risk and support proper VAT treatment, regulatory reporting and internal controls.
- More accurate performance evaluation: Leaders gain a true picture of profitability, cost efficiency and operational health, rather than relying on high-level financial signals.
- Better vendor and pricing decisions: Detailed cost analysis helps identify high-cost suppliers, negotiate better terms and understand margin impact across vendors or categories.
These benefits depend on using the right analytical techniques. The methods below form the foundation of accurate, consistent financial analysis.
Core Techniques Used in Financial Statement Analysis
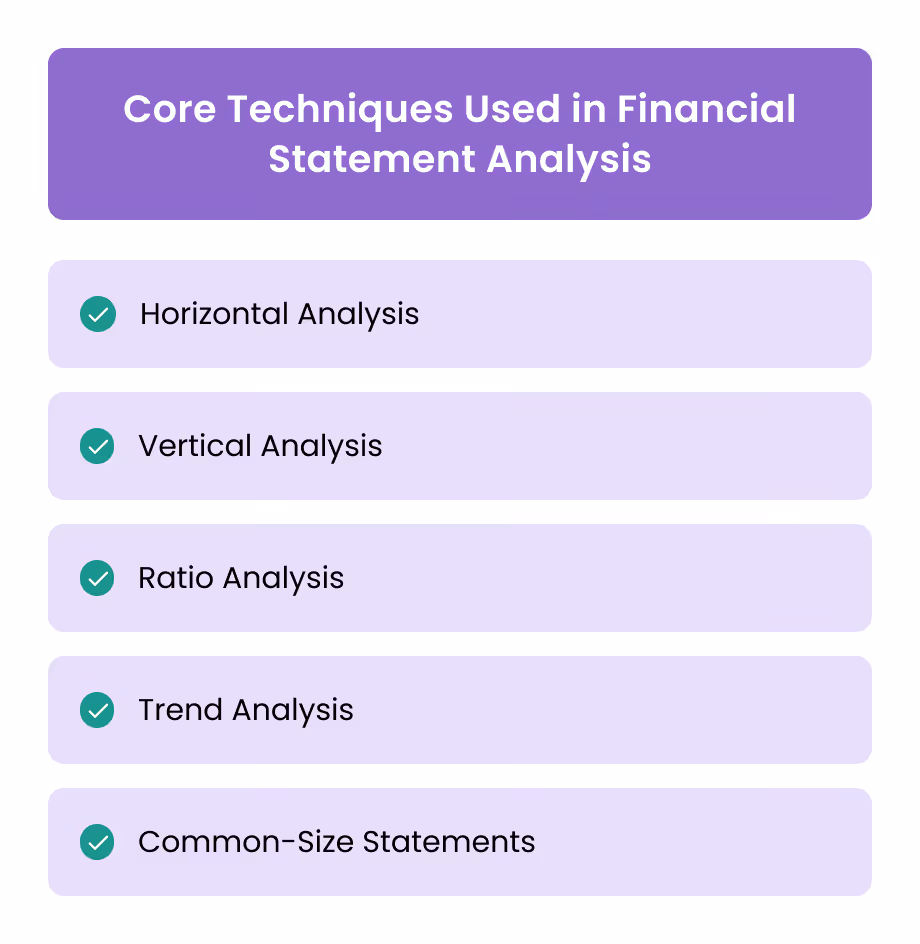
Financial statement analysis relies on a set of structured techniques that help finance teams interpret numbers accurately and compare performance over time.
The most commonly used methods include:
1. Horizontal Analysis
Horizontal analysis compares financial results across multiple periods to show how key items such as revenue, expenses or assets are changing over time. It helps identify growth patterns, cost shifts and emerging risks.
2. Vertical Analysis
Vertical analysis expresses each line item as a percentage of a base figure, such as revenue or total assets. This makes it easier to assess cost structure, margin behaviour and the relative weight of different accounts within a statement.
3. Ratio Analysis
Ratio analysis uses numerical relationships to evaluate different aspects of financial performance.
- Liquidity ratios: ability to meet short-term obligations
- Profitability ratios: efficiency in generating profit
- Efficiency ratios: effectiveness in using assets
- Leverage ratios: level of debt and financial risk
Ratios help compare results across periods or against industry benchmarks.
4. Trend Analysis
Trend analysis looks at patterns over several reporting periods to identify whether performance is improving, declining or remaining stable. It is useful for spotting early signals that may not be obvious in a single period’s results.
5. Common-Size Statements
Common-size statements convert each line item into a percentage of revenue for the income statement or total assets for the balance sheet. This standardised format makes it easier to compare results across periods or between companies of different sizes.
How to Interpret the Most Important Financial Ratios
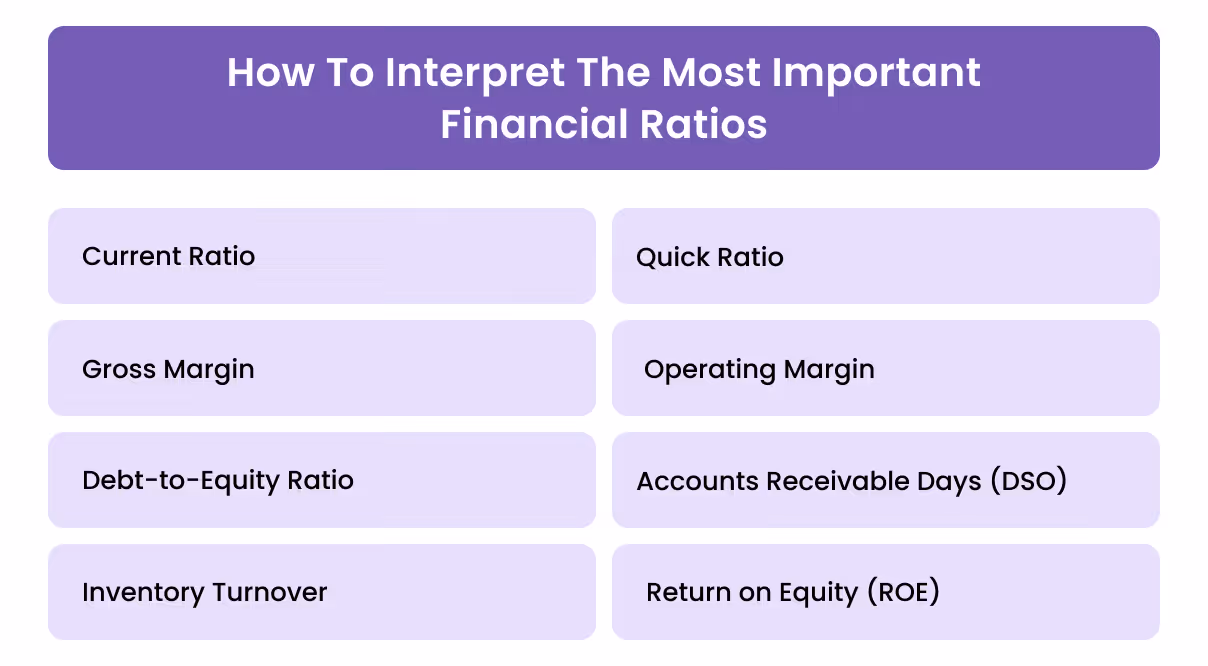
Financial ratios help leaders assess the organisation’s liquidity, profitability, efficiency and leverage. Here is how to interpret the ratios that matter most in financial analysis.
1. Current Ratio
The current ratio compares current assets to current liabilities. A higher ratio indicates stronger short-term liquidity and the ability to meet near-term obligations. Extremely high ratios can signal underutilised assets or inefficient working-capital management.
2. Quick Ratio
The quick ratio removes inventory from current assets to measure the company’s ability to pay short-term obligations using its most liquid resources. It is a more conservative measure of liquidity and is useful for businesses with slow-moving inventory.
3. Gross Margin
Gross margin shows how much profit remains after direct costs such as materials and production. A declining margin can indicate rising costs, pricing pressure or inefficiencies in the cost of goods sold.
4. Operating Margin
Operating margin measures the profitability of core business operations after operating expenses. It helps leaders assess whether overheads are controlled and whether the business model is scalable.
5. Debt-to-Equity Ratio
Debt-to-equity compares total liabilities to shareholders’ equity, indicating how much of the business is financed through debt. A rising ratio increases financial risk and affects the organisation’s ability to borrow or withstand downturns.
6. Accounts Receivable Days (DSO)
DSO measures how long it takes to collect payments from customers. Higher DSO signals slow collections, strained cash flow or weak credit control. Lower DSO improves liquidity and reduces reliance on external financing.
7. Inventory Turnover
Inventory turnover indicates how efficiently inventory is being sold and replaced. Low turnover suggests slow-moving stock, excess inventory or forecasting issues, while high turnover reflects strong demand and efficient stock management.
8. Return on Equity (ROE)
ROE measures how effectively the company uses shareholder capital to generate profit. Higher ROE indicates strong financial performance, but extremely high figures may signal excess leverage.

How to Conduct Financial Statement Analysis
A strong financial analysis process goes beyond reviewing numbers. It helps finance leaders understand the story behind performance, identify early warning signs and guide strategic decisions.
Here is a practical workflow used by effective finance teams.
1. Gather Complete and Accurate Financial Data
Start with clean, fully reconciled financial statements for the periods you are reviewing, ensuring all supporting documents are up to date and consistent. This creates a reliable foundation before any interpretation begins.
What to look for:
- Missing or incomplete reconciliations
- Unusual or recurring manual adjustments
- Gaps in supporting schedules or notes
2. Review Each Statement Individually
Before linking insights across statements, review the balance sheet, income statement and cash flow statement separately to understand the standalone story each one tells.
This step helps isolate issues before connecting the dots.
What to look for:
- Movements in key asset and liability categories
- Shifts in margins or overheads
- Changes in operating vs non-operating cash flows
3. Apply Horizontal and Vertical Analysis
Use horizontal analysis to examine period-over-period changes and vertical analysis to understand how each line item contributes to the overall structure. Together, they reveal shifts that may not be obvious from absolute numbers.
What to look for:
- Expenses increasing faster than revenue
- Inventory or receivables rising out of proportion
- Asset utilisation declining over time
4. Calculate Key Financial Ratios
Once the statements are understood in context, use ratio analysis to assess liquidity, profitability, efficiency and leverage. Ratios standardise performance, making comparisons more meaningful.
What to look for:
- Sudden drops in liquidity ratios
- Margin compression across periods
- Slower receivable collection
- Higher leverage or rising debt dependency
5. Analyse Cash-Flow Health Separately
Evaluate cash flow on its own rather than relying solely on profit. This helps determine whether the business can sustain operations, support growth and manage obligations without external pressure.
What to look for:
- Negative or volatile operating cash flow
- High working capital tied up in receivables or inventory
- Reliance on external financing for routine expenses
6. Identify Trends and Variances Across Periods
Look beyond individual figures to identify recurring patterns or variances over time. Trend analysis reveals underlying behaviour shaping financial performance.
What to look for:
- Recurring spikes in expenses
- Seasonal swings that affect liquidity
- Variances that consistently exceed the budget
7. Compare Against Budgets and Forecasts
Use variance analysis to understand where performance diverged from expectations and why. This step strengthens future planning and improves financial discipline.
What to look for:
- Underestimated cost categories
- Revenue shortfalls due to inaccurate assumptions
- Timing differences affecting cash position
8. Evaluate Risks and Opportunities
Translate your findings into a forward-looking view of risks to mitigate and opportunities to leverage. This ensures analysis feeds directly into strategic action.
Risks to watch:
- Rising DSO
- Increasing debt or leverage
- Margin erosion
- Vendor concentration risks
Opportunities to act on:
- Improving collections
- Renegotiating supplier pricing
- Adjusting product pricing or cost structure
9. Summarise Findings for Decision-Making
End with a concise, insight-driven summary that leadership can act on. Focus on clarity, quantification and next steps so decisions are grounded in accurate analysis.
Strong summaries should include:
- A clear diagnosis
- Quantified impact
- Specific next steps
With the analysis complete, the next challenge is ensuring the underlying data is accurate. This is where financial analysis often breaks down.
Also read: Guide to Preparing Financial Statements Efficiently
Where Financial Analysis Breaks Down and How Modern Tools Fix It
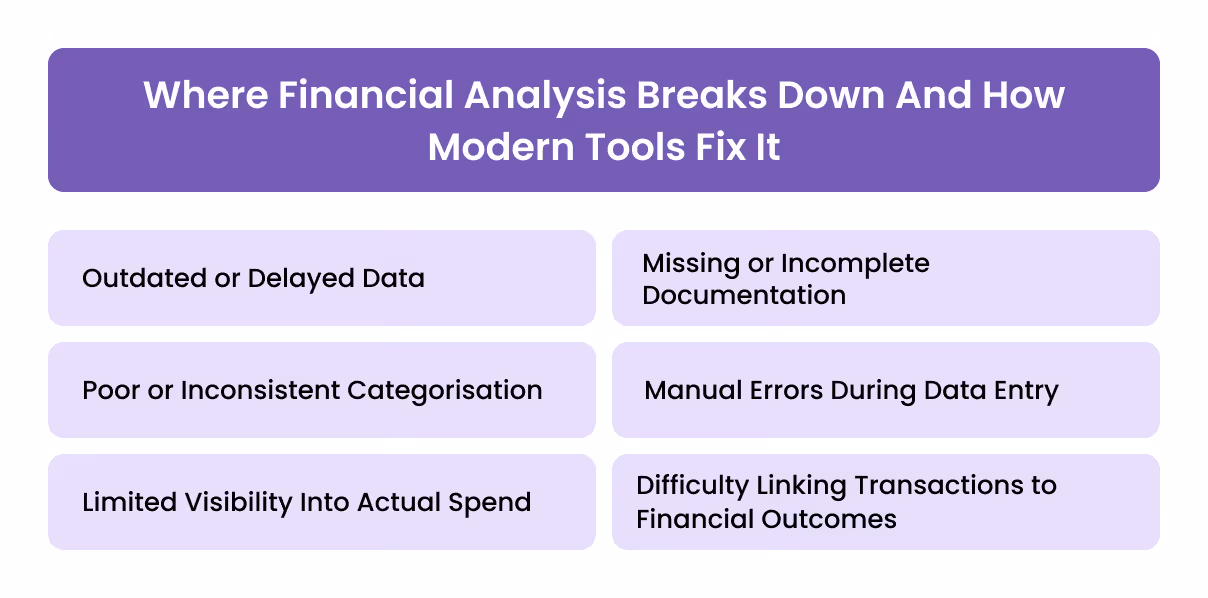
Financial statement analysis is only as strong as the data behind it. Manual processes often create gaps in accuracy, documentation and visibility, leading to unreliable insights.
Here are the most common challenges finance teams face and how modern tools resolve them.
1. Outdated or Delayed Data
When numbers are updated infrequently, analysis reflects what happened weeks ago, not what is happening today. This weakens forecasting, liquidity planning and decision-making.
How modern tools solve it: Real-time expense visibility ensures financial statements are supported by up-to-date spending data, making analysis far more accurate.
2. Missing or Incomplete Documentation
Lost receipts or incomplete invoice details slow down reconciliation and complicate audits.
How modern tools solve it: Automated receipt capture and VAT extraction create complete and compliant documentation, ensuring every transaction has supporting evidence.
3. Poor or Inconsistent Categorisation
Incorrect coding distorts cost analysis, margin evaluation and budget comparisons.
How modern tools solve it: AI-driven categorisation applies consistent, accurate coding from the moment a transaction is submitted, improving the reliability of financial analysis.
4. Manual Errors During Data Entry
Human error during posting, adjustments or reconciliations can lead to misstated financials and time-consuming corrections.
How modern tools solve it: Automated reconciliation matches receipts to transactions, flags discrepancies and eliminates manual data entry.
5. Limited Visibility Into Actual Spend
When spend is scattered across teams, cards or systems, finance leaders struggle to understand spending patterns or link them to financial outcomes.
How modern tools solve it: Centralised dashboards consolidate all spend data, improving visibility and supporting more accurate analysis.
6. Difficulty Linking Transactions to Financial Outcomes
Without audit trails or clear documentation, determining how certain expenses impact profitability or cash flow becomes difficult.
How modern tools solve it: Digital audit trails connect every transaction to its receipt, category and approval, making financial outcomes easier to interpret.
Fixing these issues starts with having reliable, real-time spend data feeding your financial statements. That’s the role Alaan plays.

How Alaan Supports Better Financial Analysis
Alaan strengthens financial analysis by ensuring the data feeding your statements is accurate, complete and updated in real time. With unified corporate cards, expense management and accounting automation, finance teams get a reliable foundation for better decision-making.
With Alaan, finance teams gain:
- Real-time visibility into all business spend: Transactions from every team and card appear instantly, ensuring analysis is based on current data instead of delayed reports.
- Consistent and accurate categorisation: Alaan Intelligence automatically categorises expenses using rules and historical patterns, improving the reliability of trend analysis and cost reviews.
- Automated VAT extraction and compliance checks: Receipts are scanned, VAT is extracted automatically, and non-compliant invoices are flagged, ensuring clean data for financial statements.
- Faster, error-free reconciliation: Receipts are matched to transactions instantly and synced to accounting software such as Zoho Books, QuickBooks, and NetSuite, reducing manual corrections.
- Complete, audit-ready documentation: Every transaction includes its receipt, category, cost centre and approval trail, improving transparency and simplifying audits.
- More accurate budgeting, forecasting and performance analysis: Clean, structured and real-time spend data gives leaders a clearer view of cash flow, margins and vendor activity.
Alaan provides the strong data foundation that accurate financial analysis depends on, helping finance teams move from manual clean-up to strategic insight.
Wrapping Up
Financial statement analysis is essential for understanding performance and making informed decisions, but its accuracy depends on clean and timely data. Manual processes and incomplete documentation often limit the value of that analysis.
Alaan removes these barriers by providing real-time spend visibility, automated categorisation, VAT-compliant documentation and seamless accounting integration.
Book a demo to see how Alaan enhances financial control and supports more accurate financial analysis.
FAQs
1. What are the five financial statement analysis methods?
Horizontal analysis, vertical analysis, ratio analysis, trend analysis and common-size statements. These methods help assess liquidity, profitability, efficiency and leverage.
2. What is financial statement analysis?
It is the process of reviewing a company’s balance sheet, income statement and cash flow statement to evaluate its performance, liquidity and overall financial health.
3. What are the four types of financial statements?
Balance sheet, income statement, cash flow statement and statement of changes in equity.
4. What are the five components of financial statements?
Assets, liabilities, equity, income and expenses, which together show financial position and operating performance.