
Deloitte’s 2025 Global Chief Procurement Officer Survey shows why procurement data can no longer sit in delayed reports. Procurement teams that invested strongly in digital capabilities were more likely to meet or exceed cost-savings plans, with 96% of leaders meeting or exceeding their targets compared with 80% of followers. The same survey also found that 64% of respondents prioritised greater supply chain visibility as a risk mitigation strategy.
For UAE finance and procurement teams, this makes procurement and spend analytics more than a reporting exercise. Supplier costs, contract leakage, card spend, invoices, and approvals often sit across different systems, which makes it difficult to see where money is actually going.
Procurement and spend analytics help close that gap. They give teams a clearer view of supplier spend, category movement, policy exceptions, and budget pressure before small issues turn into larger control problems.
In this blog, we will explain how procurement and spend analytics work, what dashboards and reports should include, which spend analysis techniques matter, and how finance teams can turn spend data into better control.
TL;DR / Key Takeaways
- Procurement and spend analytics help finance and procurement teams understand spend across suppliers, categories, departments, and payment channels.
- A useful procurement spend analysis dashboard should highlight exceptions, policy breaches, supplier concentration, and contract leakage, not just total spend.
- Spend analytics reports are only reliable when supplier names, categories, invoices, card spend, and accounting data are clean and connected.
- Vendor spend analytics helps businesses identify duplicate suppliers, negotiate better terms, and reduce supplier dependency risk.
- The real value of spend analytics comes from acting on the data through better approvals, supplier consolidation, budget controls, and payment discipline.
What Procurement And Spend Analytics Mean
Procurement and spend analytics refer to the process of collecting, cleaning, categorising, and analysing business spend data to understand purchasing behaviour and improve decisions.
At a basic level, spend data exists across multiple sources such as procurement systems, accounts payable, expense platforms, and accounting records. Analytics brings this data together and turns it into usable insight.
It is useful to distinguish between a few related concepts:
- Spend Data
Raw transaction data from invoices, payments, expenses, and procurement systems. - Spend Analysis
The process of organising and reviewing this data to understand patterns. - Spend Analytics
Ongoing, structured analysis supported by dashboards, reports, and tools that help teams take action. - Spend Management Analytics
A broader layer that connects analytics to controls such as approvals, policies, and payment processes.
In practice, procurement analytics is not just about understanding past spend. It is about identifying where decisions need to change before new spend occurs.
Also Read: Understanding Spend Visibility Business Benefits
Why Spend Analytics Matters In Procurement
Spend analytics becomes valuable when it moves beyond reporting totals and starts influencing procurement decisions.
Without structured analytics, procurement teams may rely on fragmented information. This can lead to duplicate suppliers, inconsistent pricing, off-contract purchases, and missed savings opportunities.
With proper analytics, teams can:
- Identify where supplier concentration is too high
- Detect price differences across vendors or teams
- Spot purchases happening outside approved suppliers
- Monitor whether negotiated terms are being followed
- Understand which categories are growing faster than expected
- Track payment behaviour and working capital impact
This is particularly important for finance teams. Spend analytics connects procurement decisions to financial outcomes such as cost control, payment timing, and budget variance.

McKinsey notes that procurement sits at the centre of large volumes of internal and external data, including spend, demand patterns, supplier information, and market intelligence. This supports the point that analytics helps procurement move beyond basic cost reporting into better commercial decision-making.
What A Procurement Spend Analysis Dashboard Should Show
A procurement spend analysis dashboard is not just a visual summary. It should help teams identify where action is required.
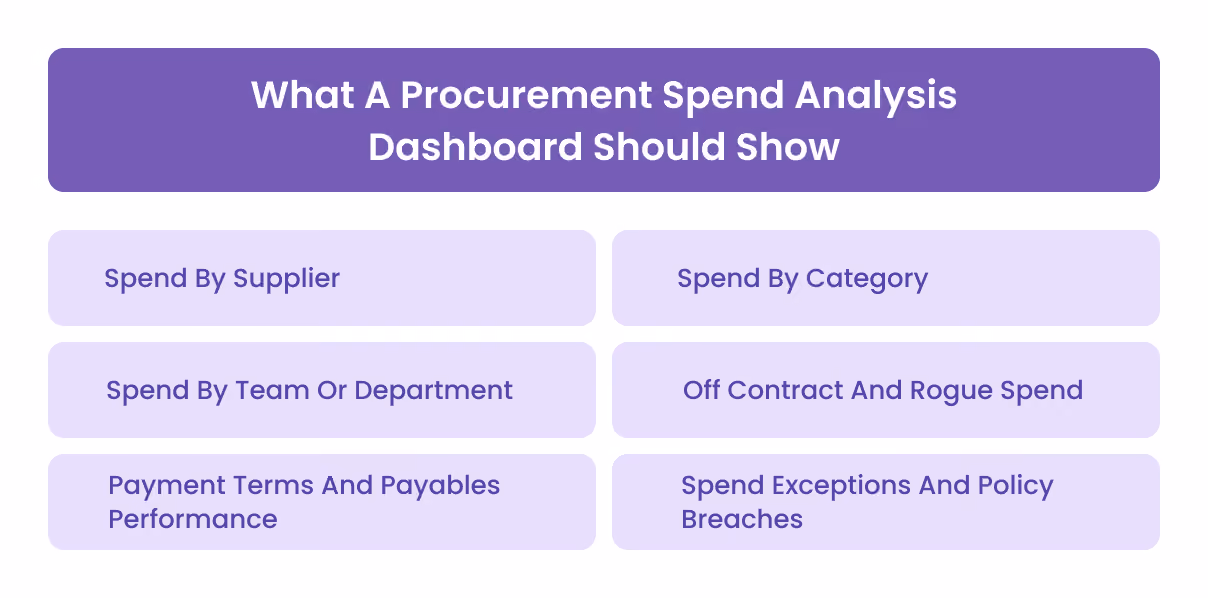
1. Spend By Supplier
This view highlights how much is being spent with each vendor. It helps identify concentration risk, duplicate suppliers, and opportunities to consolidate spend.
2. Spend By Category
This shows how spending is distributed across categories such as software, logistics, marketing, or professional services. It helps detect unusual growth or inefficiencies.
3. Spend By Team Or Department
This view helps finance teams understand which departments are driving spend and whether that spend aligns with budgets.
4. Off Contract And Rogue Spend
A critical view that shows purchases made outside approved vendors or negotiated terms. This is often where leakage occurs.
5. Payment Terms And Payables Performance
This highlights how invoices are being paid, including overdue payments, early payments, and overall payment behaviour.
6. Spend Exceptions And Policy Breaches
This includes transactions with missing documentation, unusual amounts, or purchases that bypass standard approval workflows.
A useful dashboard does not just present data. It highlights patterns that require investigation or action.
Also Read: Top Spend Management KPIs Every Finance Leader Should Track
The Main Spend Analytics Reports Finance Teams Need
While dashboards provide a high-level view, detailed reports help teams analyse specific areas of spend.
Vendor Spend Report
This report shows total spend by supplier, helping identify key vendors, overlaps, and potential consolidation opportunities.
Category Spend Report
This report breaks down spend across categories and highlights where costs are increasing or deviating from expectations.
Budget Variance Report
This compares actual spend with planned budgets across departments or projects.
Contract Compliance Report
This identifies whether purchases are being made through approved suppliers and agreed terms.
Tail Spend Report
This highlights fragmented, low-value purchases that are often unmanaged and difficult to track.
Payment Terms Report
This reviews how payment timing aligns with agreed terms and identifies opportunities to improve cash flow.
Related: Tail Spend Management Procurement
Spend Analysis Techniques That Improve Procurement Decisions
Dashboards and reports are only as useful as the techniques behind them. Without structured analysis methods, spend data remains descriptive rather than actionable.
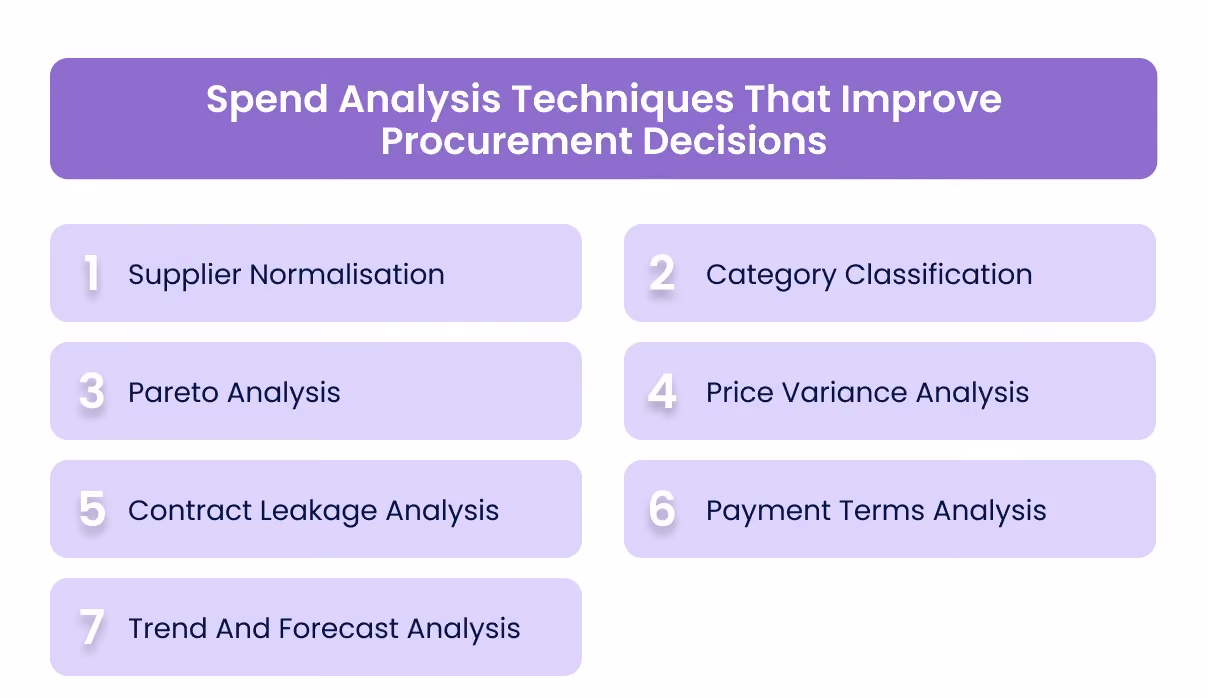
1. Supplier Normalisation
The same supplier may appear under multiple names across invoices, systems, or teams. Without normalisation, spend is fragmented and difficult to analyse.
Standardising supplier names ensures that total spend with each vendor is visible and comparable.
2. Category Classification
Grouping transactions into meaningful categories allows teams to understand where money is going. Without consistent categorisation, it becomes difficult to compare similar purchases or identify cost drivers.
3. Pareto Analysis
A small number of suppliers or categories often account for a large portion of total spend. Identifying these allows teams to focus efforts where impact is highest.
4. Price Variance Analysis
Comparing prices paid for similar goods or services across suppliers or teams can highlight inconsistencies and potential savings opportunities.
5. Contract Leakage Analysis
This technique identifies spend that should have followed negotiated contracts but did not. It helps detect purchases made outside agreed suppliers or terms.
6. Payment Terms Analysis
Analysing payment timing helps identify early payments, missed discounts, or delays that may affect supplier relationships or working capital.
7. Trend And Forecast Analysis
Tracking spend trends over time helps teams anticipate changes and take action before costs increase further.
Related: Procurement Automation Software Solution
Vendor Spend Analytics For Supplier Control
Vendor spend analytics focuses specifically on how money is distributed across suppliers and how those relationships impact cost, risk, and performance.
A clear view of vendor spend allows procurement and finance teams to move beyond transactional purchasing and take a more strategic approach.
Key insights include:
- Identifying top suppliers and dependency risk
- Detecting duplicate or overlapping vendors
- Evaluating whether supplier concentration is too high
- Highlighting opportunities for renegotiation
- Monitoring whether agreed pricing and terms are followed
- Tracking supplier-level exceptions such as disputes or delays
This analysis is not only about cost savings. It also supports risk management, supplier reliability, and long-term procurement strategy.
Also Read: Cost Reduction Strategies In Procurement
How Digital Procurement Spend Analytics Works
Digital procurement spend analytics brings together data from different systems and turns it into structured insights.
1. Capture Spend Data From Multiple Sources
Spend data is typically spread across procurement tools, accounts payable systems, expense platforms, and accounting records. Bringing this data together is the first step.
2. Clean And Standardise The Data
Data quality issues such as inconsistent supplier names, missing fields, and formatting differences need to be resolved before analysis.
3. Categorise Spend Into A Taxonomy
Transactions are grouped into categories so that similar purchases can be analysed together.
4. Build Dashboards And Reports
Dashboards allow teams to view spend across suppliers, categories, departments, and time periods.
5. Turn Insights Into Action
The final step is to act on the insights. This may involve renegotiating supplier contracts, consolidating vendors, tightening approval workflows, or adjusting budgets.
Digital tools make this process faster, but the value comes from how insights are used, not just how they are generated.
Spend Analytics Best Practices
Spend analytics becomes effective when it is built around decision-making rather than reporting alone.
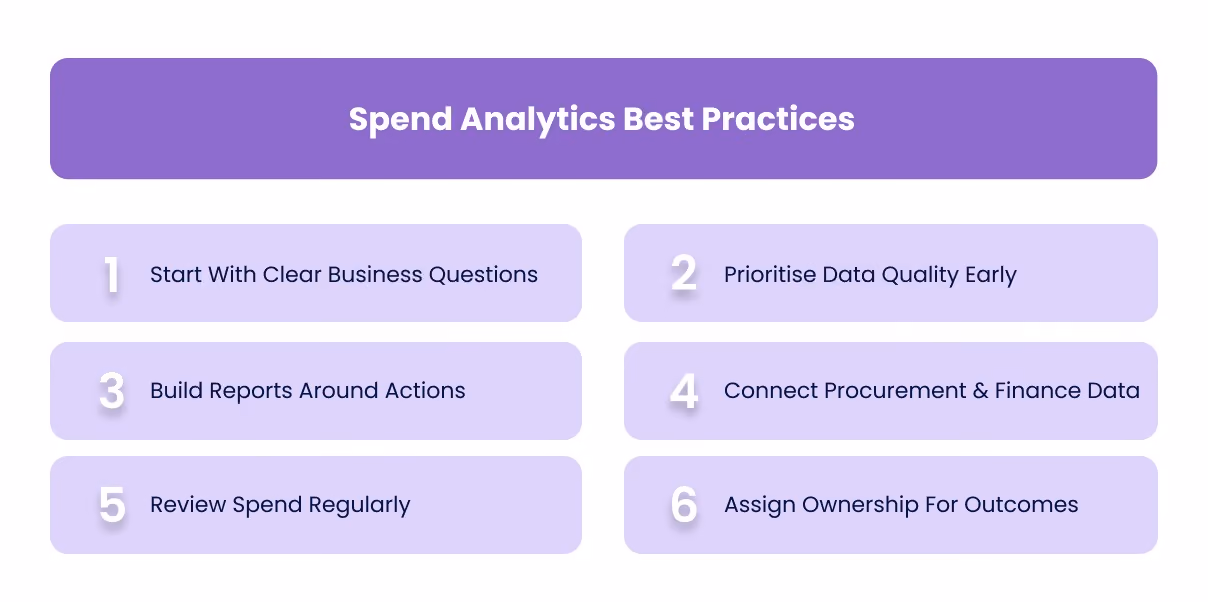
1. Start With Clear Business Questions
Analytics should answer specific questions such as which suppliers drive the most spend, where policy breaches occur, or which categories exceed budgets.
2. Prioritise Data Quality Early
Clean and consistent data is essential. Without it, dashboards may present misleading insights.
3. Build Reports Around Actions
Each report should support a decision, such as renegotiation, supplier consolidation, or approval changes.
4. Connect Procurement And Finance Data
Spend analytics should include data from procurement, expenses, accounts payable, and accounting systems to provide a complete view.
5. Review Spend Regularly
Monthly or quarterly reviews help teams identify trends and respond quickly.
6. Assign Ownership For Outcomes
Insights need ownership. Someone should be responsible for acting on supplier, category, or policy-related findings.
Common Mistakes In Procurement And Spend Analytics
Even when businesses invest in analytics tools or dashboards, the outcomes often fall short because of execution gaps. These issues typically do not come from lack of data, but from how that data is handled and used.
1. Building Dashboards Before Cleaning The Data
Dashboards built on inconsistent supplier names, missing categories, or incomplete records create misleading insights. Teams may act on incorrect conclusions without realising the underlying data is flawed.
2. Tracking Total Spend Without Category Depth
Looking only at total spend hides where money is actually going. Without category-level breakdown, it becomes difficult to identify cost drivers or inefficiencies.
3. Ignoring Employee And Card Based Spend
A significant portion of spend often sits outside procurement systems, especially through corporate cards or reimbursements. Excluding this data creates blind spots in analysis.
4. Treating Vendor Spend As A Static Report
Vendor spend analytics should be reviewed continuously. Treating it as a one-time report prevents teams from responding to changes in supplier pricing, usage, or dependency.
5. Measuring Savings Without Tracking Execution
Identifying savings opportunities is not enough. If renegotiation, consolidation, or policy changes are not implemented, the analytics does not translate into real impact.
6. Reviewing Spend Too Late
Monthly or quarterly reports may highlight issues, but if the data is delayed, teams miss the opportunity to influence decisions before spend occurs.
7. Separating Procurement Analytics From Finance Processes
When procurement data is not connected to accounts payable, expenses, and accounting, it becomes harder to reconcile spend and maintain accuracy.
Related: Business Spend Management Tools Importance
How Alaan Helps Finance Teams Improve Spend Visibility
Procurement and spend analytics depend on the quality and timeliness of underlying data. If transactions, receipts, invoices, and approvals are fragmented, even the best dashboards will be limited.
Alaan focuses on strengthening this execution layer so that analytics is based on clean, structured, and real-time information.
- Corporate Cards With Spend Controls
Businesses can manage spending with defined limits and merchant restrictions, reducing uncontrolled or untracked transactions. - Real Time Visibility Into Spend
Finance teams can monitor expenses as they happen across teams, categories, and vendors. - Structured Approval Workflows
Purchases can be reviewed before they occur, ensuring alignment with budgets and policies. - Centralised Receipt And Invoice Capture
All supporting documents are linked to transactions, improving traceability and reducing missing data. - Seamless Accounting Integration
Integrations with systems like Xero, QuickBooks, NetSuite, and Microsoft Dynamics ensure that spend data flows accurately into financial records. - Cleaner Reconciliation And Audit Readiness
With structured data and documentation, finance teams can reconcile transactions more efficiently and maintain clear audit trails.

By improving how spend data is captured and managed, Alaan helps ensure that procurement and spend analytics reflect actual business activity and support better decisions.
Also Read: Modern Expense Management Guide
Conclusion
Procurement and spend analytics play a critical role in helping businesses understand and control how money is spent. When implemented effectively, they provide visibility into suppliers, categories, teams, and patterns that would otherwise remain hidden.
However, analytics alone is not enough. The value comes from turning insights into actions, whether that means renegotiating supplier terms, consolidating vendors, tightening approvals, or improving documentation.
For finance teams, the focus should be on building a system where data is accurate, timely, and connected across procurement, expenses, and accounting. This ensures that decisions are based on reliable information rather than fragmented reports.
If you want to strengthen how your business tracks and controls spend, you can explore how Alaan helps finance teams improve visibility, enforce controls, and maintain accurate financial data. Book a demo to see how structured spend management supports better procurement decisions.
Frequently Asked Questions
1. What Data Sources Should Feed A Procurement Spend Analytics Dashboard
Spend analytics dashboards should include data from procurement systems, accounts payable, expense platforms, corporate cards, and accounting systems to provide a complete view of business spending.
2. How Often Should Procurement Spend Analytics Reports Be Reviewed
High-level dashboards should be monitored regularly, while detailed reports are typically reviewed monthly or quarterly depending on business needs and spend volume.
3. What Is The Difference Between Spend Visibility And Spend Analytics
Spend visibility focuses on tracking where money is going, while spend analytics involves analysing that data to identify patterns, risks, and opportunities for improvement.
4. How Does Vendor Spend Analytics Help Supplier Negotiations
It highlights how much is being spent with each supplier, identifies pricing inconsistencies, and provides data that can be used to renegotiate terms or consolidate vendors.
5. Why Does Poor Categorisation Make Spend Analytics Unreliable
Without consistent categorisation, similar transactions may be grouped incorrectly, making it difficult to compare spend and identify trends accurately.
6. Can Spend Analytics Help Detect Maverick Or Off Contract Spend
Yes, by analysing transactions against approved suppliers and policies, spend analytics can highlight purchases that fall outside standard procurement processes.