

End‑of‑month reconciliations can feel like detective work. A vendor invoice you weren't expecting appears. Two different teams have paid for the same software. Marketing spends more than planned, but you only notice weeks later.
These gaps happen because businesses often don't have a clear map of where their money goes. A recent spend management study found that companies with full visibility into expenses save around 5.8% more each year than those relying on manual reports.
In this article, we explore what spend mapping is, why it matters, the key steps to implement it, and the KPIs finance teams should track to stay in control of their spending.
Key Takeaways:
- Many businesses lose money due to hidden spending and delayed visibility.
- Spend mapping gives finance teams a clear view of where every dirham goes.
- Structured steps turn scattered expense data into actionable insights.
- Tracking KPIs ensures spend mapping delivers measurable savings.
What Is Spend Mapping?
Spend mapping is the process of organising and visualising every expense in your business to understand exactly who is spending, where, and why. It turns raw transactions into a clear picture of your company's spending behaviour.
Unlike simple expense reports, spend mapping connects the dots across departments, vendors, and categories. This allows finance teams to:
- See the full flow of money across the organisation.
- Identify duplicate or unnecessary expenses quickly.
- Understand which teams or suppliers drive the most spending.
In simple terms, spend mapping delivers a full overview of spend across suppliers, services, and departments, offering detailed transparency and breakdowns by category.
Also Read: What is a Spend Management System?
Key Steps to Effective Spend Mapping
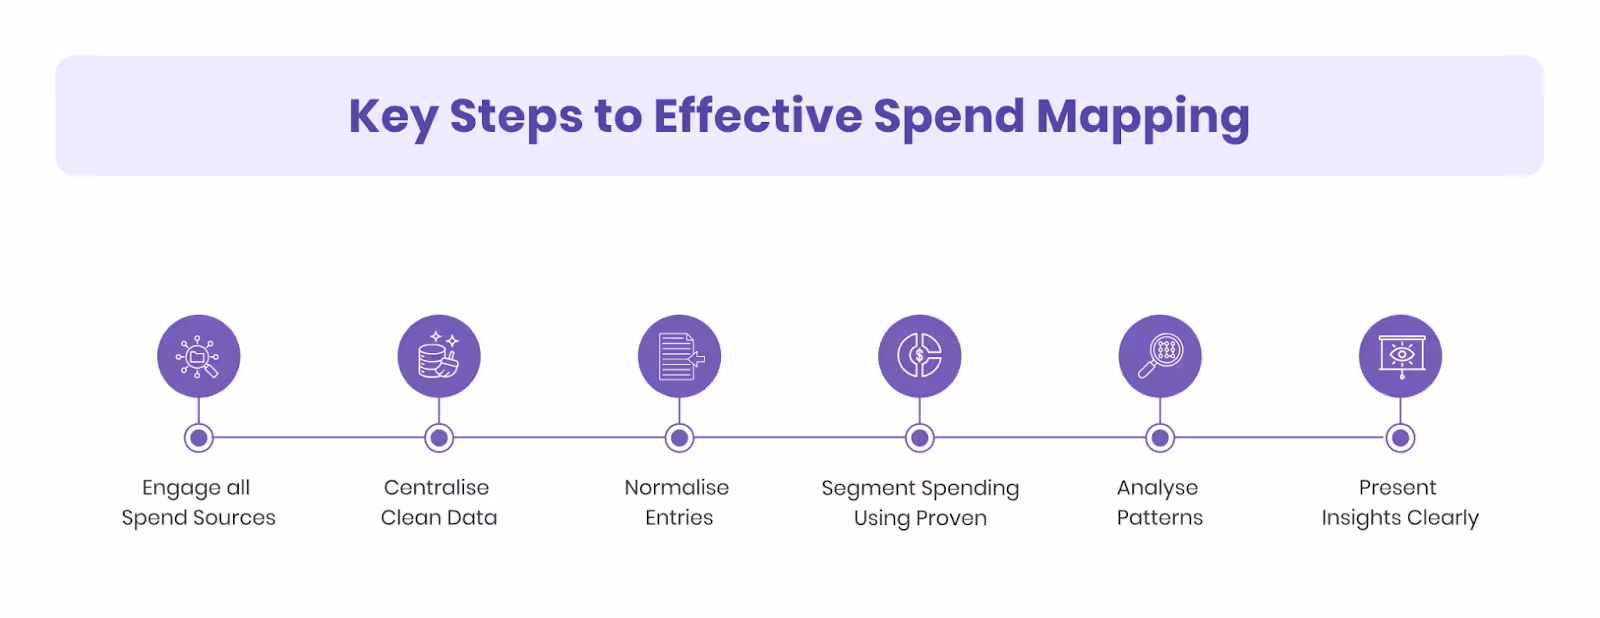
Empowering finance and procurement teams to make smarter decisions starts with a repeatable process. Follow these refined steps, drawn from industry best practices, to unlock real value:
1. Identify and Engage all Spend Sources
Map every place expenses originate, from ERP and accounting systems to corporate cards, invoices, and informal team purchases. Involve departments like finance, procurement, IT, and operations to ensure completeness.
Missing data can mask significant spend patterns, including irregular or maverick purchases.
2. Gather and Centralise Clean Data
Collect comprehensive transaction details, supplier names, PO numbers, invoice dates, and amounts into a single data store. This consolidated approach lays a solid foundation for reliable analysis and prevents hidden costs from slipping through.
3. Cleanse and Normalise Entries
Address errors such as inconsistent supplier naming, missing entries, and duplicates. For instance, consolidate variations like “ABC Supplies Ltd” and “ABC Supplies” into one vendor profile. Clean data is essential to accurate insights.
4. Segment Spending Using Proven Frameworks
Categorise expenses by supplier, department, project or category using structured models such as ABC analysis (the Pareto 80/20 principle) or the Kraljic matrix. This helps prioritise high-impact categories and unmanaged tail spend.
5. Analyse Patterns to Uncover Opportunities
Explore your data to reveal duplicate payments, under-utilised suppliers, seasonal spikes, or contract leakage. Use tools like spend cubes or Pareto charts to prioritise where action offers the greatest ROI.
6. Present Insights Clearly and Act
Create intuitive dashboards that highlight spend by category, team or supplier. Present actionable recommendations, such as vendor consolidation or workflow improvements, complete with timelines and benefits. Regular updates ensure visibility and impact over time.
Spend mapping is not a one-time audit, it’s a continuous cycle. Each iteration sharpens spend visibility, boosts compliance, and drives cost savings across the organisation.
KPIs to Track for Spend Mapping
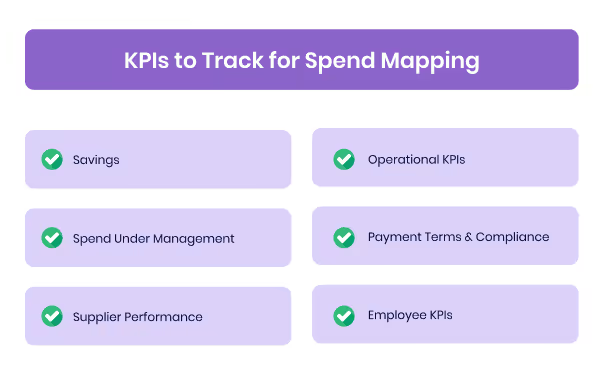
Tracking the right KPIs ensures your spend mapping efforts deliver measurable business results rather than just reports. These metrics highlight savings, efficiency, and supplier performance, helping finance and procurement teams turn insights into action.
- Savings: Measures the reduction in total expenditure achieved through better supplier negotiations, improved procurement processes, and elimination of waste.
- Spend Under Management: Shows the proportion of total spend that is actively monitored and controlled by finance or procurement, reducing hidden and maverick spend.
- Supplier Performance: Tracks on‑time delivery rates, defect rates, and contract compliance to ensure suppliers consistently meet expectations.
- Operational KPIs: Measures the efficiency of procurement processes, including cycle time for purchase orders, invoice accuracy, and reconciliation speed.
- Payment Terms and Compliance: Evaluates adherence to agreed payment terms, average payment days, and capture of early payment discounts.
- Employee KPIs: Monitors employee efficiency in handling purchase orders and expense submissions, ensuring smooth adoption of spend mapping practices.
What to Look for in Spend Mapping or Analytics Software
The right software can transform spend mapping from a manual task into a continuous, insight‑driven process. Demand for these solutions is accelerating, and the global business spend management software market is expected to nearly triple, growing from $23.36 billion (AED 85.8 billion) in 2024 to $57.22 billion (AED 210.5 billion) by 2032.
Finance and procurement teams should prioritise these features when choosing a solution:
- Comprehensive Data Integration: Ensure the software can connect with your ERP, accounting, and payment systems to bring all company spend into one central view. This removes blind spots and eliminates scattered data sources.
- Real‑Time Dashboards and Reporting: Choose tools that update spend data instantly and offer clear dashboards. Real‑time insights allow teams to spot overspending or errors before they become costly.
- AI‑Driven Analytics and Automation: Look for platforms with AI capabilities that can cleanse, categorise, and analyse transactions automatically. Advanced analytics also help predict trends and highlight potential cost‑saving opportunities without manual effort.
- User‑Friendly Interface: Spend mapping should simplify workflows, not add complexity. Software should have an intuitive interface that works across devices and requires minimal training.
- Scalability and Flexibility: The platform should adapt to your company’s growth, integrate with new tools as needed, and handle multi‑department or multi‑entity spend structures.
- Robust Security and Compliance: Sensitive financial data must be protected. Look for strong security protocols and compliance with local regulations, including VAT standards in the UAE.
- Customisable Reporting and Insights: Effective tools allow tailored reports and dashboards for different stakeholders, from CFOs to department heads, enabling actionable decision‑making without manual spreadsheets.

How Alaan Elevates Spend Mapping
Alaan is an all‑in‑one spend management platform that makes spend mapping real‑time, automated, and effortless for finance teams. It integrates corporate cards, AI‑powered automation, and built‑in controls to ensure every expense is captured, categorised, and actionable.
- Full Spend Visibility: Track every company expense in one place, from card payments to uploaded receipts, giving finance teams 100% visibility into where, how, and when money is spent.
- AI‑Powered Receipt Capture: Upload a receipt, and Alaan automatically extracts vendor names, VAT, TRNs, and amounts, matching them to the correct transaction.
- Smart Categorisation & Analytics: Automatically group expenses by supplier, department, or category, and access instant analytics without relying on spreadsheets.
- Custom Approval Flows: Set up single or multi‑level approvals to match your company’s hierarchy, ensuring no expense is processed without the right sign‑off.
- Built‑In Spend Controls: Apply spending limits, vendor restrictions, or freeze cards instantly to prevent overspending and enforce policy compliance.
- Seamless ERP and Accounting Integrations: We connect with Xero, QuickBooks, NetSuite, and Microsoft Dynamics, automatically syncing expenses to reduce reconciliation time from weeks to minutes.
Schedule a Demo and experience how Alaan simplifies spend mapping.
Conclusion
Spend mapping is more than an accounting exercise, it’s a strategic advantage. By giving finance teams a clear view of every dirham spent, it reduces waste, improves compliance, and uncovers opportunities for savings that often remain hidden in spreadsheets and late reports.
Modern finance teams need accuracy, speed, and visibility, not manual reconciliations and delayed insights.
This is where Alaan makes the difference. We turn spend mapping into a continuous, automated process that drives better decisions every day.
FAQs
1. How often should a company update its spend mapping?
The most effective approach is continuous or monthly mapping. Waiting for quarterly or year‑end analysis increases the risk of duplicate payments, unapproved spending, and missed savings opportunities.
2. Can spend mapping support VAT audits in the UAE?
Yes. By keeping all receipts and invoices organised with VAT and TRN details, spend mapping makes audits faster and reduces the risk of penalties for non‑compliance. With our platform, we automatically flag missing TRNs or non‑compliant invoices so your records are always audit‑ready.
3. What challenges do companies face without spend mapping?
Finance teams often deal with hidden spend, delayed insights, and errors like duplicate payments. Without mapping, negotiating supplier contracts or controlling budgets becomes reactive instead of proactive.
4. How does automation improve spend mapping?
Automation eliminates manual work. With Alaan, we capture receipts, categorise expenses, and generate real‑time reports automatically, helping finance teams make faster and more confident decisions.
5. Can spend mapping identify opportunities for supplier consolidation?
Absolutely. By showing which vendors receive the most payments and which ones are underutilised, spend mapping highlights areas where consolidating suppliers can reduce costs and improve negotiation leverage. We provide dashboards that make these insights visible instantly.
6. How does spend mapping help prevent overspending in real time?
Traditional spend mapping is often retrospective, spotting issues only after month‑end. With our platform, we give finance teams live visibility into every transaction. You can set spend limits, vendor restrictions, and instant card freezes, ensuring that overspending is stopped before it happens.