.avif)

Every finance team thinks they have a payment problem until they discover they actually have a measurement problem.
Suppliers complain about delays. Employees blame approvals. Leadership worries about cash flow. The instinct is to fix the process faster. But speed is not the issue when nobody can see where invoices are getting stuck in the first place.
For UAE businesses managing growing transaction volumes, the difference between a smooth finance operation and a reactive one often comes down to a handful of accounts payable metrics. The right numbers reveal hidden bottlenecks before they become costly mistakes. In this guide, we'll explore the key AP metrics UAE finance teams should track, how they improve audit readiness, and which tool can help monitor them in real time.
Key Takeaways:
- The eight AP metrics that matter most are DPO, Invoice Processing Time, Cost Per Invoice, Exception Rate, Payment Error Rate, Discount Capture Rate, AP Turnover Ratio, and Touchless Invoice Rate.
- If you're starting from scratch, track Invoice Processing Time first, DPO second, and Cost Per Invoice third to identify bottlenecks, cash flow opportunities, and automation ROI.
- A healthy AP function keeps supplier payments aligned with agreed terms, maintains invoice exception rates in the single digits, and continuously increases touchless processing through automation.
- AP metrics are increasingly a compliance tool in the UAE, where the FTA conducted 93,000 inspection visits in 2024, making accurate invoice and payment records more important than ever.
- The fastest way to improve AP metrics is through automation, which reduces manual processing, lowers errors, strengthens audit trails, and gives finance teams real-time visibility over payables.
What Are Accounts Payable Metrics?
Accounts payable metrics are quantitative measures used to evaluate how efficiently, accurately, cost-effectively, and compliantly a business manages its payables process. They help finance teams move beyond intuition and assess the real performance of AP operations using data.
More importantly, AP metrics are not vanity numbers sitting on a dashboard. A useful metric should trigger action, highlight risk, or influence a decision. If a number does not help a finance team improve cash flow, reduce errors, strengthen supplier relationships, or maintain compliance, it is just reporting for reporting's sake.
Most AP metrics fall into two categories:
- Operational metrics measure how quickly and accurately invoices move through the process, from receipt to payment.
- Financial metrics measure the impact of AP decisions on working capital, liquidity, and overall cash management.
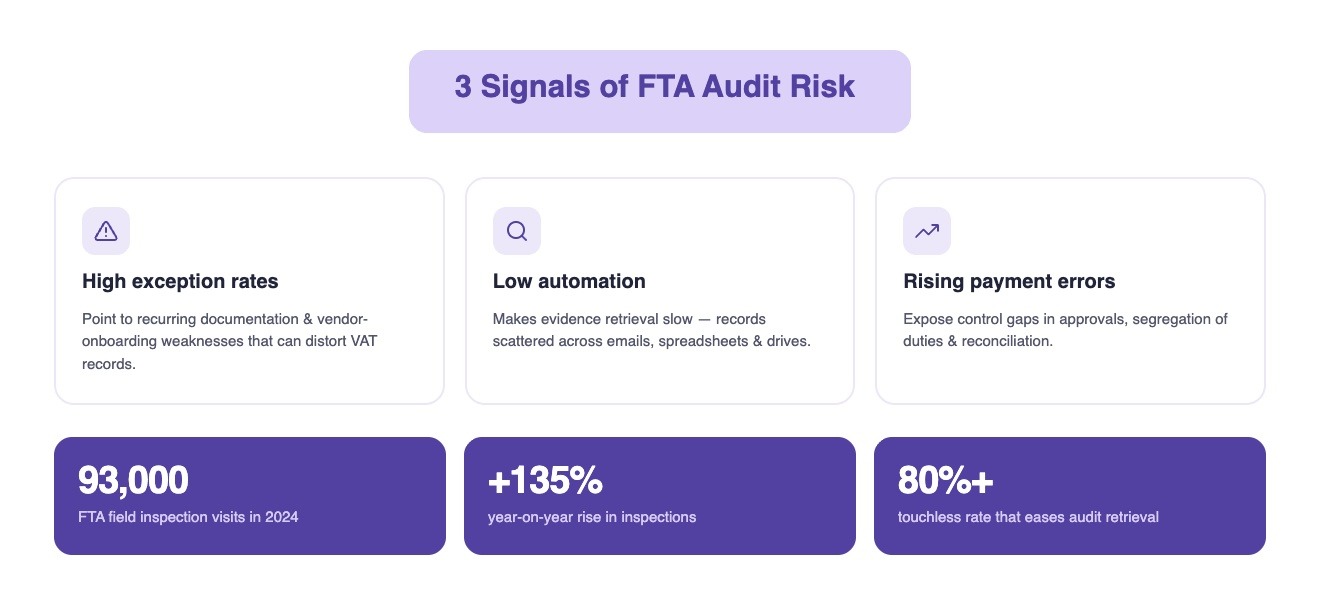
For UAE businesses, tracking these metrics has become increasingly important as tax compliance becomes more data-driven. In 2024, the UAE's Federal Tax Authority (FTA) conducted 93,000 field inspection visits, a 135% increase compared to the previous year, while expanding its use of digital technologies to identify compliance gaps and inconsistencies in business records.
During reviews, invoice documentation, payment records, VAT evidence, and supporting AP data are often among the first records examined.
Also Read: Accounts Payable Contact: Driving Accuracy in Every Payment
The challenge, of course, is knowing which metrics actually matter, because tracking everything creates noise, while tracking the right few creates control.
The 8 AP Metrics UAE Finance Teams Should Track
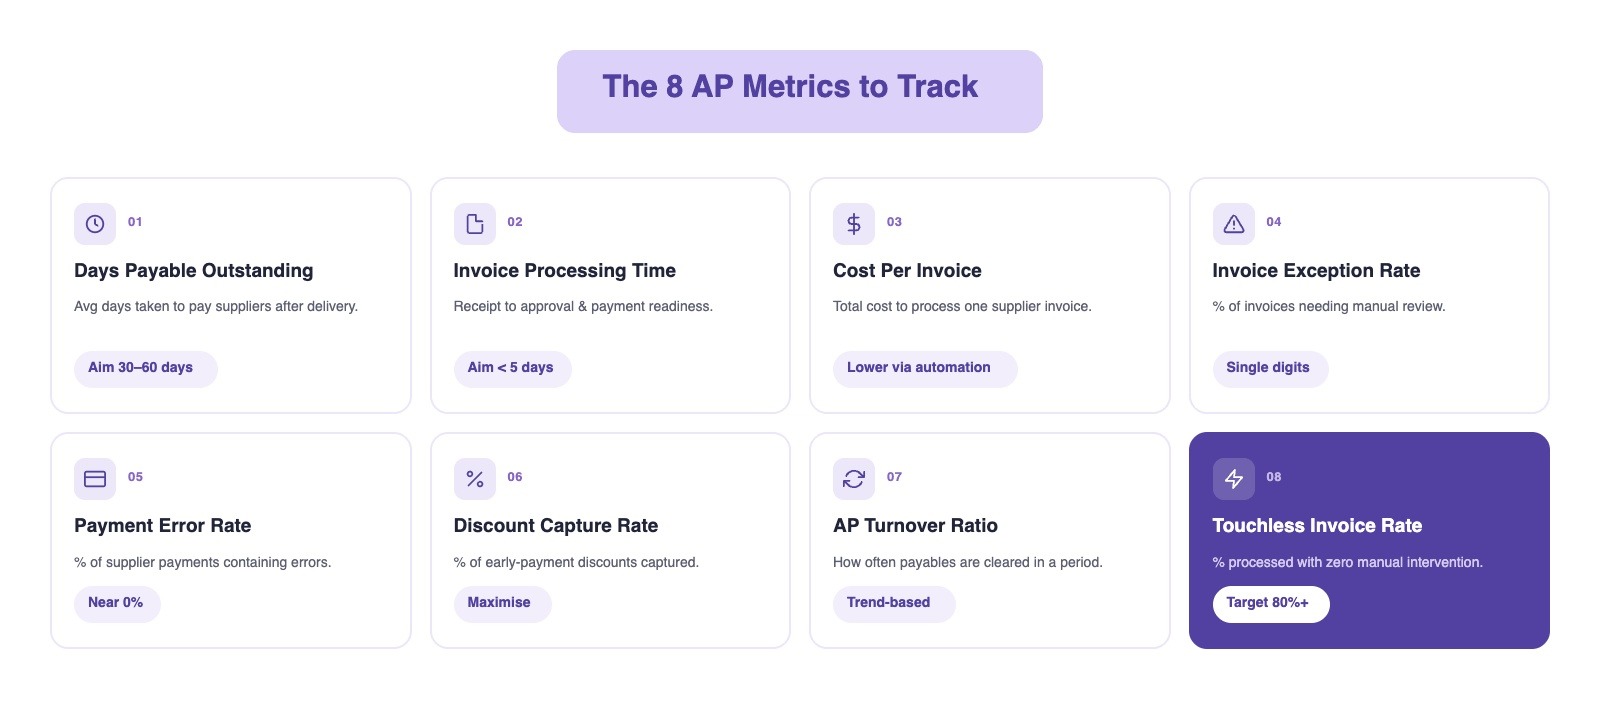
Not all AP metrics deserve a place on your dashboard. The most valuable ones do more than report performance; they reveal bottlenecks, protect cash flow, strengthen supplier relationships, and reduce compliance risk.
For each metric, we'll look at what it measures, how to calculate it, what a healthy benchmark looks like, and why it matters in a UAE business environment.
1. Days Payable Outstanding (DPO)
Days Payable Outstanding (DPO) measures the average number of days a company takes to pay suppliers after receiving goods or services. It is one of the clearest indicators of how a business balances supplier relationships with working capital management.
Formula:
(Average Accounts Payable ÷ Cost of Goods Sold) × Number of Days in Period
Why it matters:
DPO sits at the intersection of cash flow and supplier trust. A longer DPO preserves cash, but stretching payments too far can damage supplier relationships, reduce negotiating power, and limit access to favourable credit terms.
Benchmark to Aim For:
There is no universal "perfect" DPO. Globally, many businesses operate within a 30–60 day range, but the right benchmark depends on industry norms and contractual obligations. A healthy DPO is one that maximises working capital without consistently exceeding agreed payment terms.
2. Invoice Processing Time
Invoice Processing Time measures how long it takes for an invoice to move from receipt to approval and payment readiness.
Formula:
Total Invoice Processing Days ÷ Number of Invoices Processed
Why it matters:
Most payment delays do not begin with the payment itself. They begin with approval bottlenecks, missing documentation, email-based workflows, and manual data entry. Tracking processing time helps finance teams identify exactly where invoices become stuck.
Benchmark to Aim For:
Traditional AP processes often take 10–14 days to move an invoice through approval workflows, while highly automated finance teams can reduce that cycle to fewer than 5 days. Best-in-class AP functions are increasingly processing invoices in as little as 2–3 days through workflow automation and digital approvals.
Across UAE businesses on Alaan, the median invoice took 4.4 days just to get uploaded at companies with fewer than 50 employees, and 2.2 days at larger ones. Once it was in the system, approval took minutes and payment followed within a day. So if your processing time looks healthy, check where you start the clock: the biggest delay is usually the gap between a supplier sending an invoice and someone on your team logging it.
3. Cost Per Invoice
Cost Per Invoice calculates the total cost incurred to process a single supplier invoice from receipt through payment.
Formula:
Total AP Costs ÷ Number of Invoices Processed
Why it matters:
Many finance teams focus heavily on reducing headcount costs while overlooking the hidden expense of inefficient processes. Every manual touchpoint (data entry, chasing approvals, correcting errors, and supplier follow-ups) adds cost.
Benchmark to Aim For:
In mature AP functions, highly automated invoice processing can reduce costs to a fraction of traditional manual workflows. The most efficient organisations continuously lower cost per invoice without sacrificing control, accuracy, or compliance.
Real-world impact: UAE business setup consultancy Smart Zone reported saving 350+ hours per month after consolidating spend management and finance workflows, demonstrating how automation can significantly reduce the operational cost of processing transactions.
4. Invoice Exception Rate
The percentage of invoices that require manual intervention before they can be approved and paid.
Formula:
Invoices Requiring Manual Review ÷ Total Invoices Received × 100
Why it matters:
Exception handling is where AP teams lose the most time. Missing purchase orders, incorrect invoice amounts, duplicate invoices, supplier master-data issues, and incomplete documentation all slow processing and increase operational risk.
Benchmark to Aim For:
Industry guidance generally suggests keeping invoice exception rates in the single digits. The lower the exception rate, the more predictable, scalable, and efficient the AP process becomes, as fewer invoices require manual review and correction.
5. Payment Error Rate
The percentage of supplier payments that contain errors.
Formula:
Payments with Errors ÷ Total Payments Processed × 100
Why it matters:
Payment errors create more than accounting headaches. They damage supplier confidence, increase reconciliation work, and expose the business to fraud risks.
Common errors include:
- Duplicate payments
- Incorrect amounts
- Wrong supplier accounts
- Incorrect bank details
- Unauthorised payments
Benchmark to Aim For:
The ideal target is as close to zero as possible. Even a small increase deserves investigation because payment errors tend to compound as transaction volumes grow.
6. Early Payment Discount Capture Rate
The percentage of available supplier discounts successfully captured through early payment.
Formula:
Discounts Captured ÷ Discounts Available × 100
Why it matters:
Many organisations focus heavily on extending payment terms while overlooking opportunities to generate guaranteed returns through supplier discounts.
Unlike investment returns, early payment discounts are typically risk-free and immediately measurable.
Benchmark to Aim For:
A rising discount capture rate generally indicates better payment visibility and stronger AP execution. The goal is to maximise available discounts without compromising cash flow priorities.
7. AP Turnover Ratio
AP Turnover Ratio measures how frequently a company pays off its average accounts payable balance during a specific period.
Formula:
Total Purchases ÷ Average Accounts Payable
Why it matters:
This metric provides context that DPO alone cannot. It helps finance teams understand whether supplier obligations are being settled consistently or accumulating over time.
Benchmark to Aim For:
A higher ratio generally indicates faster payment cycles, while a lower ratio indicates slower settlement. Neither is automatically good or bad; what matters is whether the trend aligns with the company's working-capital strategy.
Also Read: Purchase Invoice Processing That Actually Speeds Up Approvals
8. Touchless Invoice Rate (Automation Rate)
The percentage of invoices processed from receipt to approval without any manual intervention.
Formula:
Invoices Processed Automatically ÷ Total Invoices Received × 100
Why it matters:
Touchless processing is one of the strongest indicators of AP maturity. High automation reduces processing costs, shortens cycle times, lowers error rates, and improves scalability.
Benchmark to Aim For:
Leading AP organisations increasingly target touchless processing rates of 80% or higher for standard invoices, allowing finance teams to focus their attention on exceptions and strategic work.

Knowing which metrics matter is only half the equation. The next question is where to start, especially for finance teams building their AP reporting framework for the first time.
Which Metric Should UAE Finance Teams Start With?
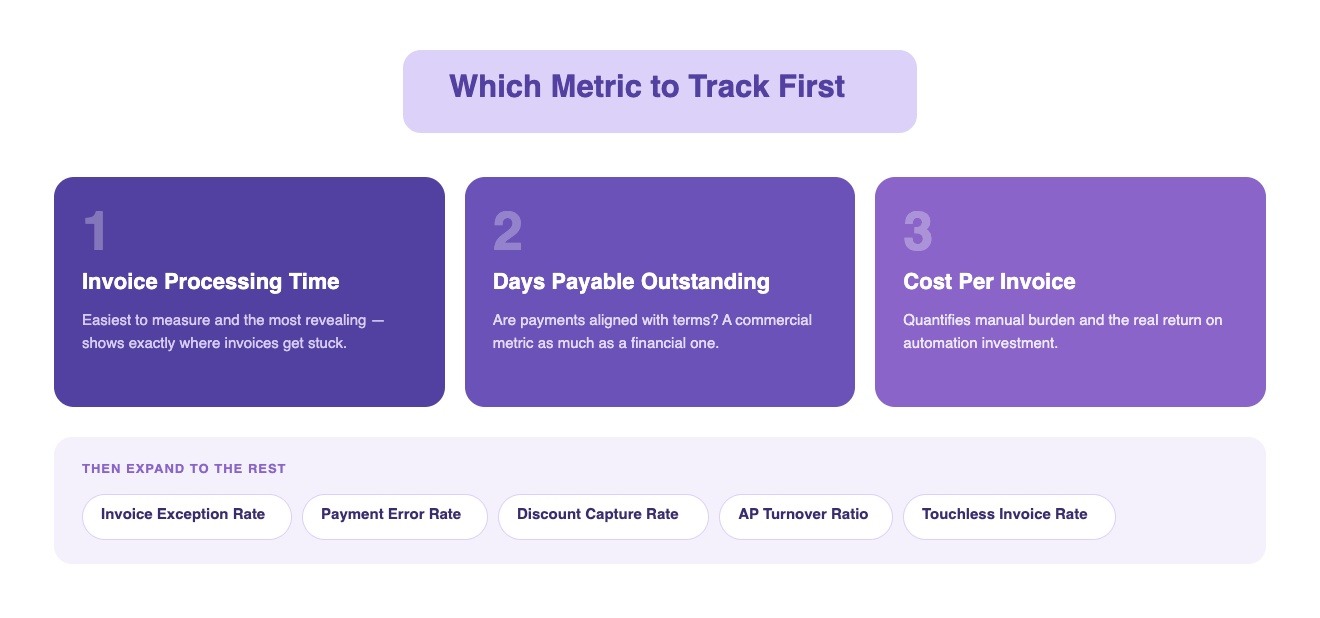
If your AP function is not tracking any metrics today, trying to monitor all eight at once usually creates eight numbers and very little clarity. The smarter approach is to build your dashboard in stages, starting with the metrics that reveal the biggest operational issues first.
A simple prioritisation framework for UAE finance teams:
1. Start with Invoice Processing Time
This is the easiest metric to measure and often the most revealing.
A long processing time quickly shows where delays are occurring:
- Invoice receipt and capture
- Approval bottlenecks
- Payment execution
- Missing documentation
Before improving AP performance, you need to know where invoices are getting stuck.
2. Add Days Payable Outstanding (DPO)
Once you understand processing speed, track DPO.
This helps answer a different question:
- Are supplier payments aligned with agreed terms?
- Is the business managing working capital effectively?
- Are supplier relationships being protected?
In the UAE, where supplier relationships often influence pricing, credit terms, and service quality, DPO is as much a commercial metric as a financial one.
3. Add Cost Per Invoice
After establishing a baseline for speed and payment behaviour, measure efficiency.
Cost per invoice helps quantify:
- The administrative burden of AP
- The impact of manual processes
- The potential return on automation investments
For many UAE SMEs, AP costs are hidden inside employee workloads rather than visible budget items, making this metric particularly valuable.
4. Expand to the Remaining Metrics
Once the first three metrics are consistently tracked, add:
- Invoice Exception Rate
- Payment Error Rate
- Early Payment Discount Capture Rate
- AP Turnover Ratio
- Touchless Invoice Rate
These metrics become significantly more useful when you already have a baseline understanding of speed, payment timing, and processing costs.
A good AP dashboard is not built by tracking everything. It is built by tracking the right metrics in the right order. For most UAE businesses, that order is simple: processing time first, DPO second, and cost per invoice third.

While these metrics are often viewed through an efficiency lens, their value extends far beyond operational performance.
AP Metrics and UAE FTA Audit Readiness
Most finance teams think of AP metrics as performance tools. The FTA sees them differently.
When an audit or inspection occurs, the question is not how quickly invoices were processed or how low processing costs were. The question is whether the business can demonstrate that every VAT claim, supplier payment, and invoice record is accurate, traceable, and properly supported.
That is why AP metrics increasingly function as early-warning indicators of audit risk.
Three signals deserve particular attention:
1. High Exception Rates Can Indicate Documentation Weaknesses
A growing exception rate often points to recurring problems in supplier documentation, invoice quality, or vendor onboarding controls. If the same issues repeatedly require manual correction, they can eventually affect the accuracy of VAT reporting and financial records.
2. Low Automation Can Make Evidence Retrieval Difficult
During an audit, finance teams may need to retrieve invoice approvals, payment records, supporting documents, and transaction histories quickly. Businesses with highly manual AP processes often spend significant time locating information spread across emails, spreadsheets, and shared drives.
A structured digital workflow makes documentation retrieval substantially easier and reduces the operational burden of responding to information requests.
3. Rising Payment Errors Often Expose Control Gaps
Payment errors rarely occur in isolation. They can signal weaknesses in approval workflows, vendor management controls, segregation of duties, or reconciliation processes. Left unchecked, these issues can create broader financial reporting and compliance risks.

The real challenge is not just choosing the right metrics; it is creating a process that makes those metrics easy to measure, monitor, and improve consistently.
Also Read: Vendor Invoice Processing: Stages, Challenges & Automation
How Alaan Helps UAE Finance Teams Track and Improve AP Metrics
Tracking AP metrics is only useful if the underlying data is accurate, timely, and easy to access. The challenge for many UAE finance teams is that AP data often lives across emails, spreadsheets, banking portals, ERP systems, and approval chains. As a result, teams spend more time gathering information than acting on it.
This is where Alaan helps.
Rather than functioning as a standalone reporting tool, Alaan centralises invoice management, approvals, payments, and spend data into a single workflow, making AP metrics easier to measure and improve.
Here's how:
- Invoice Processing Time: AI-powered invoice capture, OCR, and automated approval workflows reduce manual data entry and speed up invoice approvals.
- Days Payable Outstanding (DPO): Centralised invoice visibility helps finance teams schedule payments strategically, balancing supplier relationships with working capital goals.
- Cost Per Invoice: Accounting Automation reduces the manual effort involved in invoice coding, approvals, reconciliation, and bookkeeping, lowering the overall cost of invoice processing.
- Invoice Exception Rate: Automated validation checks help identify duplicate invoices, missing information, incorrect VAT details, and other discrepancies before payment.
- Payment Error Rate: Alaan's Spend Management platform provides real-time oversight of business spending, while approval controls help reduce duplicate, incorrect, or unauthorised payments.
- Early Payment Discount Capture Rate: Better visibility into upcoming due dates helps teams identify and act on supplier discount opportunities before they expire.
- AP Turnover Ratio: Real-time tracking of invoices and payment obligations provides greater control over supplier payment cycles and cash flow planning.
- Touchless Invoice Rate: Automated invoice capture, approval routing, matching, and recordkeeping help increase the percentage of invoices processed without manual intervention.
- VAT Compliance and Audit Readiness: Every invoice, approval, receipt, and payment record is stored digitally, creating a searchable audit trail that supports VAT compliance and FTA documentation requirements.
- ERP and Accounting Integrations: Direct integrations with accounting platforms such as Xero, QuickBooks, NetSuite, SAP, Odoo, Dynamics 365, and Zoho Books help maintain accurate AP data across systems.
Ultimately, AP metrics are only valuable when they drive better decisions, stronger controls, and measurable improvements across the finance function.
Conclusion
The decision is simple: either measure your AP performance or manage it based on assumptions.
The finance teams that improve cash flow, strengthen supplier relationships, and stay audit-ready are the ones that turn AP data into action. If you're ready to move beyond spreadsheets and manual processes, Alaan gives you the visibility, automation, and controls needed to make every AP decision with confidence.
Book a demo with Alaan and see how a smarter AP workflow can help you track, improve, and act on the metrics that matter most.
FAQs
1. What is the most important accounts payable metric to track?
There is no single metric that works for every business, but Invoice Processing Time is often the best starting point. It is easy to measure, quickly reveals workflow bottlenecks, and helps finance teams identify where delays occur before expanding into more advanced metrics such as DPO, exception rates, and automation rates.
2. What is a good Days Payable Outstanding (DPO) ratio?
A good DPO is one that aligns with supplier payment terms while supporting healthy cash flow. Many businesses operate within a 30–60 day range, but the ideal benchmark varies by industry, supplier agreements, and working-capital strategy.
3. How often should accounts payable metrics be reviewed?
Most finance teams review core AP metrics monthly, while high-volume organisations may monitor operational metrics such as invoice processing time, exception rates, and payment errors weekly. The goal is to identify trends early rather than wait for month-end reporting.
4. Which accounts payable metric has the biggest impact on cash flow?
Days Payable Outstanding (DPO) typically has the most direct impact on cash flow because it determines how long a business retains cash before paying suppliers. However, discount capture rates and AP turnover ratios can also influence working capital performance.
5. What is the difference between DPO and AP Turnover Ratio?
Both metrics measure supplier payment behaviour, but from different perspectives. DPO shows the average number of days it takes to pay suppliers, while AP Turnover Ratio measures how many times a business pays off its average accounts payable balance during a specific period.
6. Why is invoice exception rate important?
A high exception rate indicates that invoices frequently require manual review due to issues such as missing information, mismatched purchase orders, duplicate invoices, or supplier data errors. Lower exception rates generally lead to faster processing, lower costs, and fewer payment delays.
7. How do AP metrics improve UAE FTA audit readiness?
AP metrics help finance teams identify weaknesses in documentation, payment controls, and invoice processing before they become compliance risks. Monitoring metrics such as exception rates, payment error rates, and automation rates can strengthen audit trails and improve record accuracy during FTA reviews.
8. How can automation improve accounts payable metrics?
Automation reduces manual data entry, speeds up invoice approvals, lowers exception rates, improves payment accuracy, and creates stronger audit trails. As a result, finance teams can improve multiple AP metrics simultaneously rather than optimising them one at a time.
Gain control over business expenses with Alaan corporate cards
Invygo earned AED 100,000 in cashback using Alaan cards
Personalise approval workflows to align with your business needs with Alaan's Spend Management platform
Discover the power of automated expense tracking and smarter spend control with Alaan
Turn data into actionable insights with Alaan's spend management tools
Stay Tax Compliant with UAE's #1 Corporate Card and Spend Management Platform
Customisable corporate card policy template
Know how much Corporate Tax you have to pay this fiscal year
Easily integrate Alaan with your ERP for accurate, real-time expense tracking
Close books faster with Alaan's AI-powered accounting automation
Reconcile your books in minutes instead of hours, every single month.
Keep petty cash organized with Alaan corporate cards and automated expense management